Flowchart
is a diagrammatic representation of an algorithm. A flowchart is a type of diagram that represents an algorithm, workflow or process, showing the steps as boxes of various kinds, and their order by connecting them with arrows. This diagrammatic representation illustrates a solution model to a given problem. Flowcharts are used in analyzing, designing, documenting or managing a process or program in various fields. Flowchart are very
helpful in writing program and explaining program to others. Different symbols are used for different states in flowchart, For example: Input/Output and decision making has different symbols.
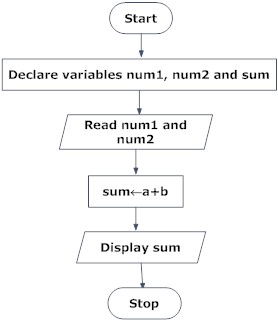
Example 1. Draw a flowchart to add two numbers entered by user.
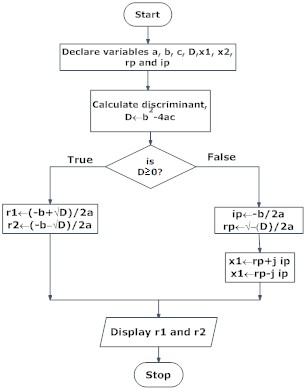
Example 2. Draw a flowchart to find all the roots of a quadratic equation ax2+bx+c=0
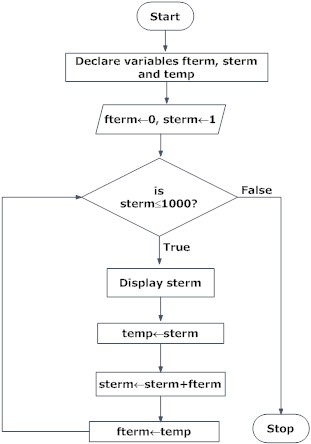
Example 3. Draw a flowchart to find the Fibonacci series till term≤1000.
Visit My Blog: vinay-kumar-saini.blogspot.com/
Example 2. Draw a flowchart to find all the roots of a quadratic equation ax2+bx+c=0
Example 3. Draw a flowchart to find the Fibonacci series till term≤1000.
Visit My Blog: vinay-kumar-saini.blogspot.com/